
Data Professional and entrepreneur looking to apply my knowledge and expertise to maximize scalability. Experienced in Excel, VBA, Python to analyze large data sets and raw data to streamline the decision-making process. Strong emphasis on working collaboratively with a like-minded team to ensure optimal results that align with the clients' interest. Proficient with deep diving into large data sets to tell a story to cultivate efficiency. A graduate from the University of California, San Diego, Data Analytics and Visualization program with the acquired ability to leverage my programming capabilities with data visualization to ensure feasible outcomes. Adept at championing data engineering skills and comprehension to ensure business success.

Below is a sampling of some recent projects. The pictures link to an interactive visualization and the code is posted on Github.
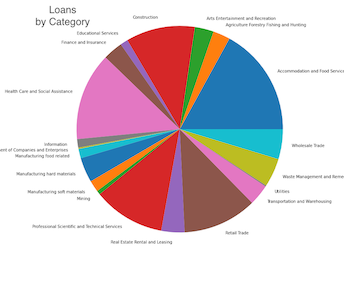
Unprecedented access to nationwide small business loan data from the Paycheck Protection Program explored using Big Data and Machine Learning tools. ETL pipeline project.
Environment: SQL, Python, Python Pandas, PySpark, Scikit-learn, Google Colab, HTML, CSS, ETL, PostgresSQL, JavaScript, Pipeline
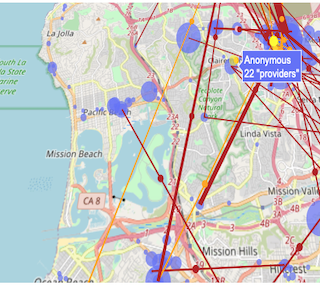
Exploration of weakened regulation in the massage industry of San Diego through forensic analysis and visualization of engineered, web scraped data.
Environment: Geocoding, Plotly, Google Maps, Python, Scrapy, Pandas, JavaScript, SQL, PHP, NLTK, HTML, CSS, Google Sheets, Excel
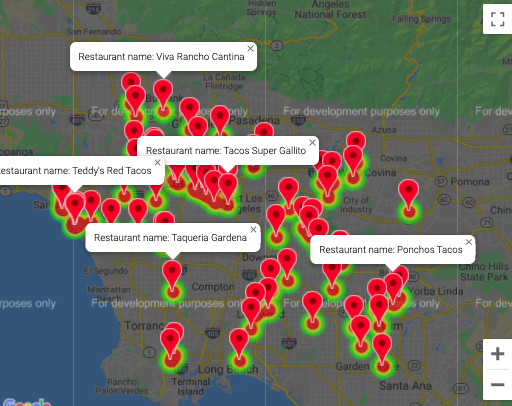
Analysis of the Los Angeles food scene and finding a few "bad actors" along the way. Munging, expunging data extracted courtesy of the Yelp Developer API. Data analysis, visualization and google mapping.
Environment: Python, Pandas, Google Maps, HTML, CSS, Microsoft Excel
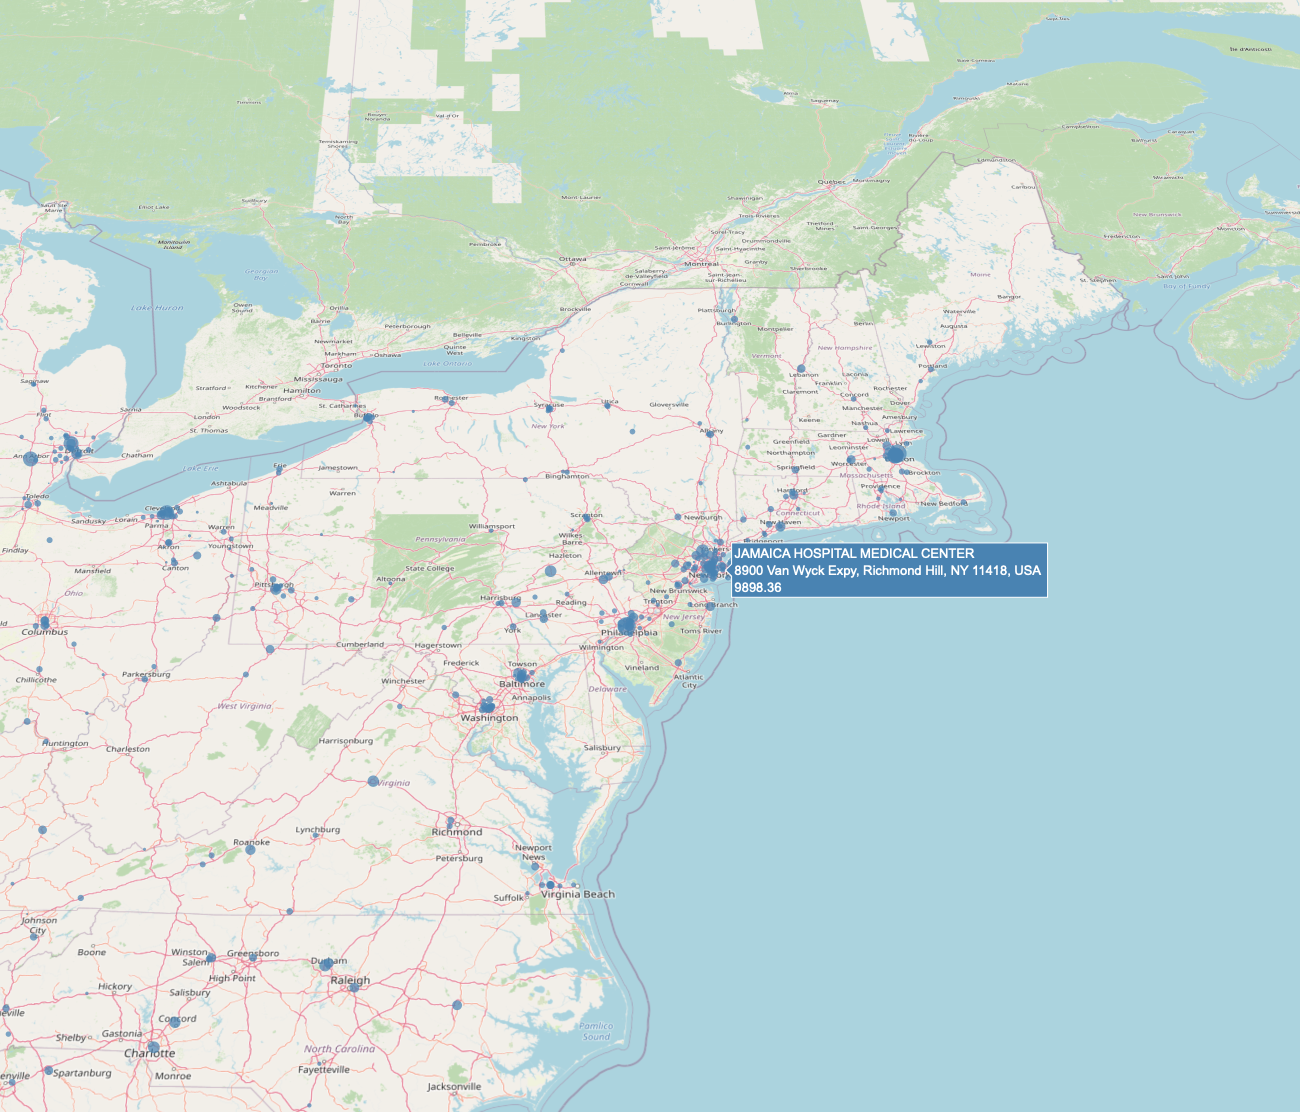
Interactive map plot of payments made by drug and medical device companies to physicians. Employed Python API call scripting to extract CMS payment information from Open Government website. Hospital locations and payment amounts illustrated on a nationwide map.
Environment: API, Python, Plotly, Socrata
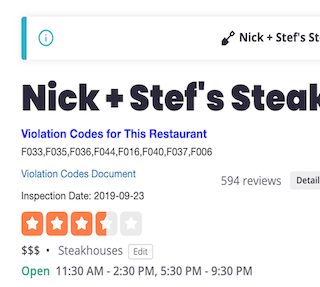
Google Chrome extension/application displays displays health code violation data for restaurants.Query two Los Angeles City API data sources to display most recent restaurant inspections on Yelp restaurant pages.
Environment: API, JavaScript, Google Developer
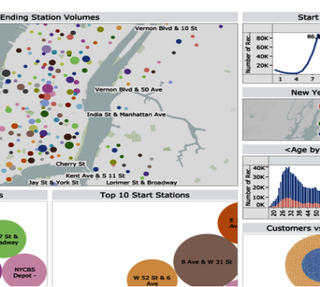
Project descriptionVisualization dashboard exploring the user data from the popular NYC bike sharing program. Automated data retrieval with Python Requests and BeautifulSoup libraries. Harnessed the power of Tableau GIS capabilities to map bikes by location and traffic pattern. Created an eye-catching display of frequency and gender use graphics, using Tableau dashboard charting.
Environment: Python, Requests and Tableau
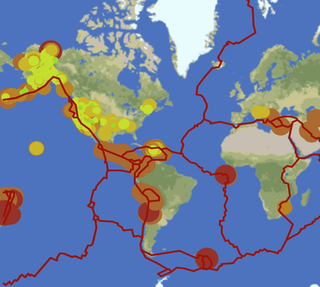
Realtime data earthquake visualization from U.S.G.S API data. Leverage GIS U.S. government data for geo-mapping visualization which allows the user interface with dynamic earthquake activity.
Environment: Python, Leaflet, D3.js, HTML, CSS, JavaScript, API

Machine learning predictive analysis to identify potential rodent infestations in Los Angeles, California restaurants with 87.8% accuracy. Information sourced from Yelp Developer API and Los Angeles, California open government program. Data engineered through processes of normalization, cleansing and modification to meet requirements of machine learning modalities.
Environment: Python, Python Pandas, Scikit-Learn
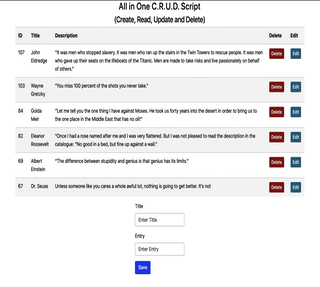
Database management via web application. Single page template to allow easy integration into existing website. CRUD (Create, Read, Update, and Delete) user interface. PHP back end for ease of deployment in likely hosting choices for small business clients.
Environment: PHP, MySQL, MariaDB, Javascript, HTML, CSS
The skillful use of a compass and map can lead to treasure. Let me be your compass to filter through what is important for your business success. What can be overwhelming for some, I find to be creative, engaging and rewarding, because great data decisions are at the heart of successful endeavors.
Here are a few of my favorite youtube videos that show the power, creativity and fun side of data science. David McCandless challenges long held assumptions through visualizations, Amy Webb "cracks" online dating and Ben Wellington takes a humorous look at NYC with data analysis including the Citi Bike program referenced above.
Thanks for taking the time to check out my page. If you want to talk business, or love python as much as I do and want to grab a cup of coffee, let's connect. The best way to reach me is through LinkedIn or on my cell (619)269-8606.