Cash for COVID

A journey through the Paycheck Protection Program data

Unprecedented access to small business loan data

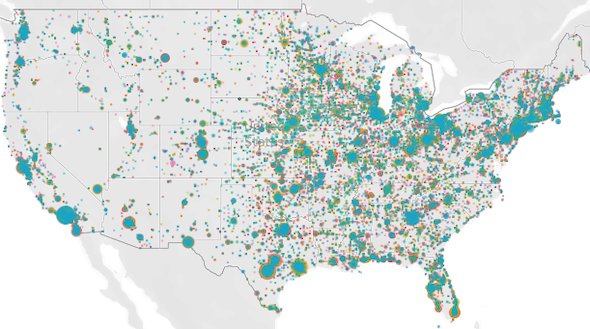
It seems that no section of the country was untouched by enterpreneurs seeking relief from the effects of the government shutdown in reaction to the Coronavirus. The release of lending records from the US Treasury in conjunction with the Small Business Association, albeit under unfortunate circumstances, allows an unusual glimpse into small businesses affected by the crisis.

This is not an analytical deep dive

The purpose of this project was to merge, wrangle and munge the data released by the SBA which was structured in a fairly useless way when it comes to analyzing the entire United States. There are over 50 related CSV files tucked away in folders for individual states. These files needed to be joined to one another in order to see the country as a whole. What would normally be an arduous process to do by hand I was able to do in minutes with programming. This resulted in a dataset of almost 5 million records, which not only needed refinement but could not be opened with Excel or Google Sheets, and so I continued the process using Python and SQL. That being said, some level of analysis is a component of any data pipeline project and what is displayed on this page and in the visualizations linked in the navigation menu are a byproduct of this light analysis. I decided to share it here because I think it is interesting, and I hope you do too. I will be continuing the statistical journy as time permits. My normalization process and github repository is accessible via the "DATA PIPELINE" link.

A note about the visualizations

The visualizatons are best viewed on a computer. They are hosted courtesy of Tableau Public which make interactivity and hosting easy but load times are influenced by the user's connection speed and the amount of data being pushed to the page. Read the paragraph at the bottom of each illustration page for further instruction on how to prevent the "spinning wheel" of a frozen web page.

nationwide
Sample representation of male (blue) vs. female (pink) loan distribution.

Initial analysis

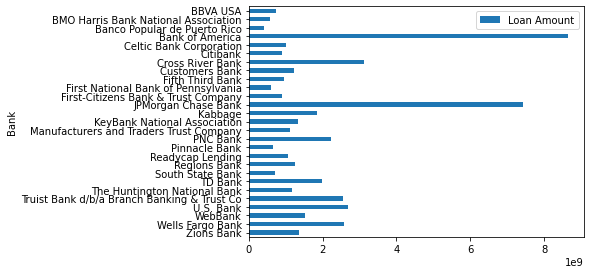
The purpose of the loans was to help businesses save jobs. The potential expenditure per capita of funds for the larger loan amounts came in at $2,000 and the under $150k disbursements at $8,000 per job saved. This assessment is based on calculations infered from statements Steve Mnuchin made, namely that the sum of the loans over $150k account for 75% of the total lent and was borrowed by only 13% of enterprises.

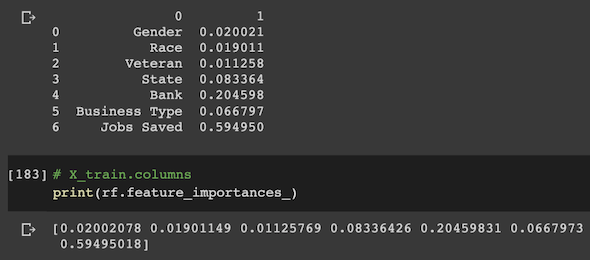
Machine learning also suggested a dependency between number of jobs "saved" and loan amounts as it gave this feature the most weight.

Even though the largest of loans seemingly went to the biggest employers, a question arises as to how effective $2000 per job would be in helping employees in comparison to the smaller business loans which had a higher amount of money per person ratio.

random forest output
Machine learning suggests the number of jobs saved has the strongest correlation to loan amounts.

Business loans and the jobs saved.

The pie charts below reflect the loan volume in each job category along with the jobs saved. This helps to evaluate where the money went and which industries supported retention of the greatest number of jobs. For example, in the visualizations below, we see that the "Acommodation and Food Services" category saved the greatest percentage of employees in proportion to how much was borrowed and "Construction" appears to be the reverse.

pie chart of loans by category
jobs saved category

The Banks

Bank of America and JP Morgan Chase were at the top of the list of lenders by count of loans, but financial tech organizations such as Kabbage and Celtic Bank made a strong showing.

jobs saved category
List of lenders descending by count
jobs saved category
Banks for loans under $150k

Potential and limitations

The combination of geographic, demographic and loan information provides seemingly endless opportunities for deeper analysis. For example, there may be differences between rural and urban jobs saved as a percentage of the local population. Another idea is to look at regional differences in loan amount, bank activity and business types which could possibly project potential economic wastelands or growth spots. Additionally, how ethnic groups are integrating into the fabric of our economy may be gleaned from the data. For example, Asians borrowed almost twice as much as Hispanics even though they are only one third the size of the Hispanic population. This may provide insight into cultural attitudes towards self employment, borrowing and/or proclivities towards certian industries.

The fact that the NAICS codes were provided for almost all of the 5 million loans might be helpful in determining our our most vulnerable industries and help to identify where to put efforts for retraining as automation replaces human labor.

It also seems like the data would be helpful in identifying money laundering concerns. For example if a business is able secure financing out of proportion with the norms due to the fact that income was a factor in loan amounts.

Limitations of the data

We do not know the motivations of many of the businesses or how the money was spent. It was supposed to save jobs, but at a 1% interest rate and the prospect of forgiveness dangled as a part of the enticement to take loans, it is possible that a lot of this wound up in savings accounts or the stock market. In terms of whether or not the data acurately reflects the larger environment, we do not know who was unable to get the loans. Additonally, some of the categories are too general to be helpful. For example in "Business Type", the values of "Sole Proprietorship", "Self Employed" and "Limited Liability Corporation" could be a gig worker or an employer of many people. As for the racial demographic information, only about 300k responded, and it is hard to say if this is a consistent sampling of loan recipients or not.

A personal note

Small businesses are often touted as the "back bone" of America, and yet it seems that a mandate in reaction to a virus swiftly cut proprietors "off at the knees". Even though this was mostly a pipeline project for me, compassion for the extreme nature of what people are experiencing led me to look at not only the general trends in an attempt to understand the effects that COVID is having on our economy but I also found myself being pulled into researching individual establishments of various categories and outliers. Some of my favorite restaurants, professional organizations, colleagues and friends appear in this database, and I am grateful for the support that this program afforded them and I hope it helps independent operators survive and thrive through the challenges from the pandemic.