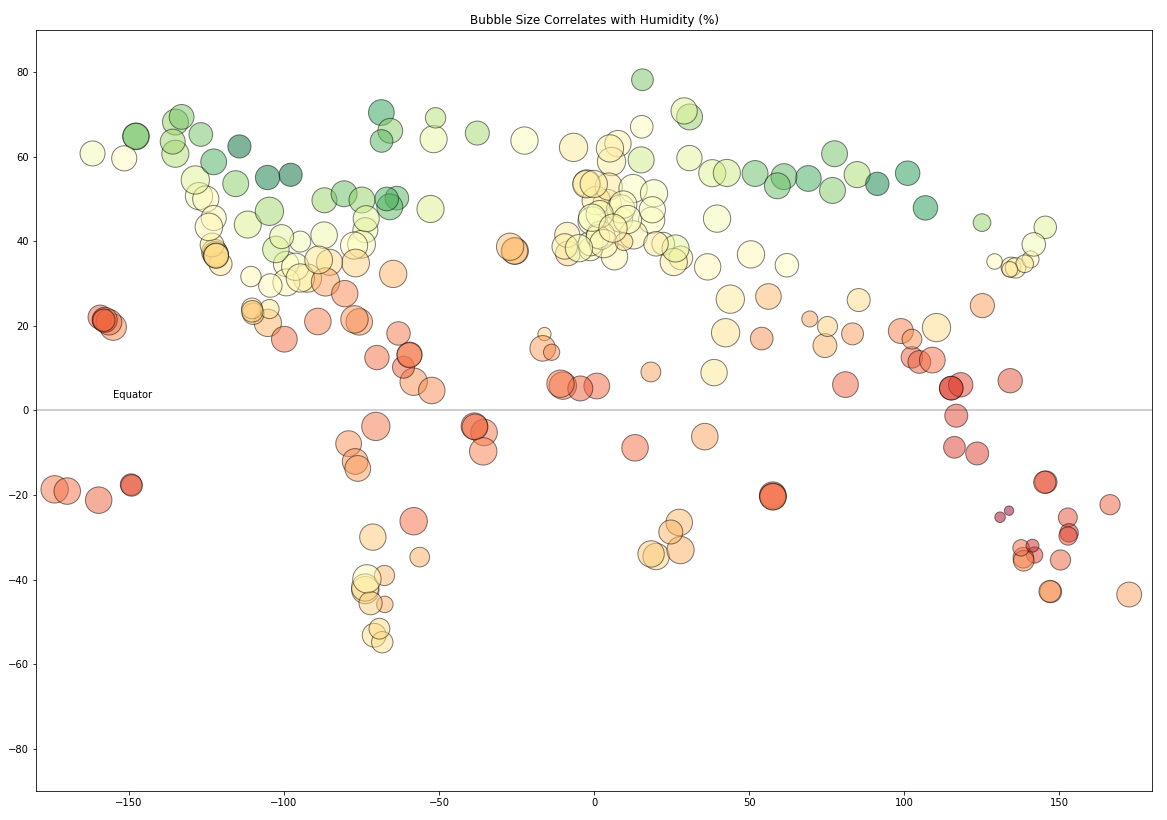
World at a Glance
This plot includes both the latitude and the longitude and therefore showing humidity worldwide. The color of each bubble indicates humidity as a percentage. The y axis is latitude and x is longitude. Since the data is collected from cities and weather readings are absent from unpopulated areas, the graph produced almost looks like a world map.
Linear Regression
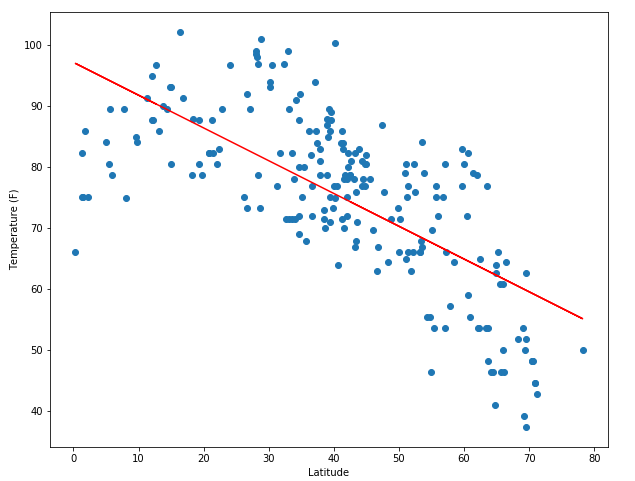
As previously noted, the strongest correlation seems to be regarding temperatures and latitude. The plot on the lower right reflects readings from the northern hemisphere.
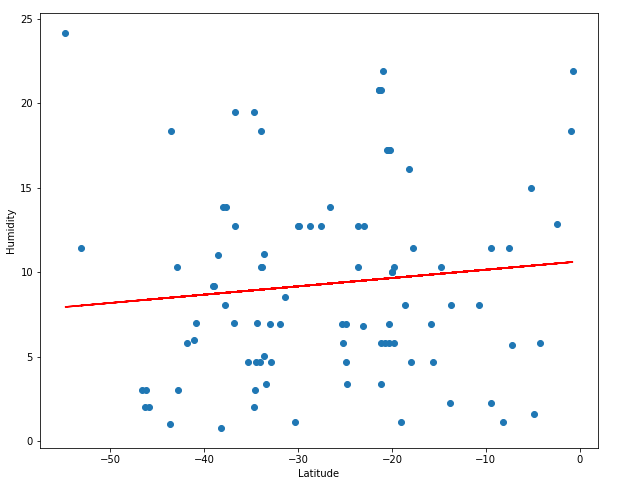
The lower left explores humidity in the southern hemisphere, and it looks like parts of Antartica were perhaps surprisingly, humid. However, the regression trendline does not appear to demonstrate much significance.